From Insight to Action: Building an Enterprise Data Platform for Urgent Care
I joined ConvenientMD to build forecasting and machine-learning systems. The first obstacle was not the model. It was that the data needed to train one lived across disconnected clinical, workforce, finance, scheduling, survey, and external systems.
That changed the scope of the work. Before I could build a dependable forecast, I needed to build the system beneath it.
I presented this work at Urgent Care Connect 2026 in Nashville. The presentation is embedded below; this post focuses on the story behind it.
The real problem was fragmentation
ConvenientMD had substantial data, but not a unified way to use it. Analysts routinely exported reports, joined files manually, and reconciled competing definitions. The EMR provided a strong view of clinical activity, but decisions about staffing or growth also depended on schedules, payroll, credentials, billing, patient feedback, marketing, and epidemiological trends.
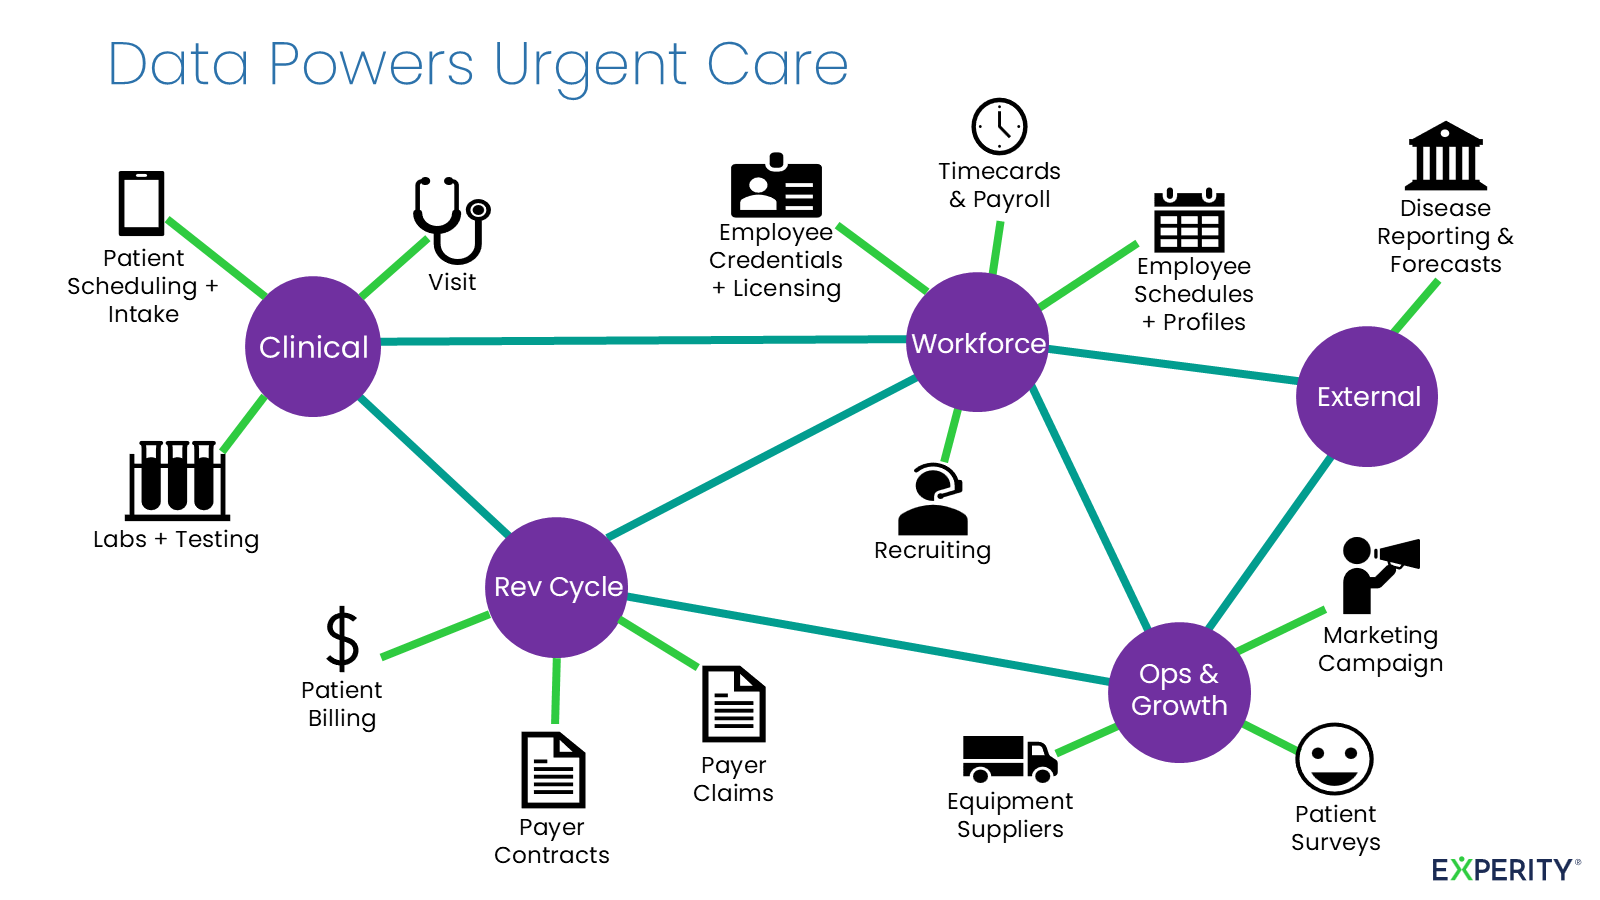
These were not independent datasets. Visit volume affects staffing; staffing affects wait time; wait time affects patient experience and lost visits. Looking at each system separately could produce an accurate report while still missing the operational problem.
The first design decision was therefore to treat this as an enterprise system—not a collection of dashboards and not a single ML project.
Building the foundation
I started lean, using Airflow, Docker, and Linux infrastructure to establish repeatable ingestion and processing. I built pipelines for APIs, SFTP transfers, database synchronization, and other vendor-specific access patterns. A particularly difficult part was reconciling multiple EMR systems, with different schemas and changing definitions, into a consistent longitudinal record.
As the value became clear, I developed the target architecture, built the cost models, presented the case to leadership, secured investment, and helped grow the team responsible for sustaining it. The platform evolved toward Snowflake, Microsoft Fabric, and Azure ML rather than remaining a set of one-off pipelines.
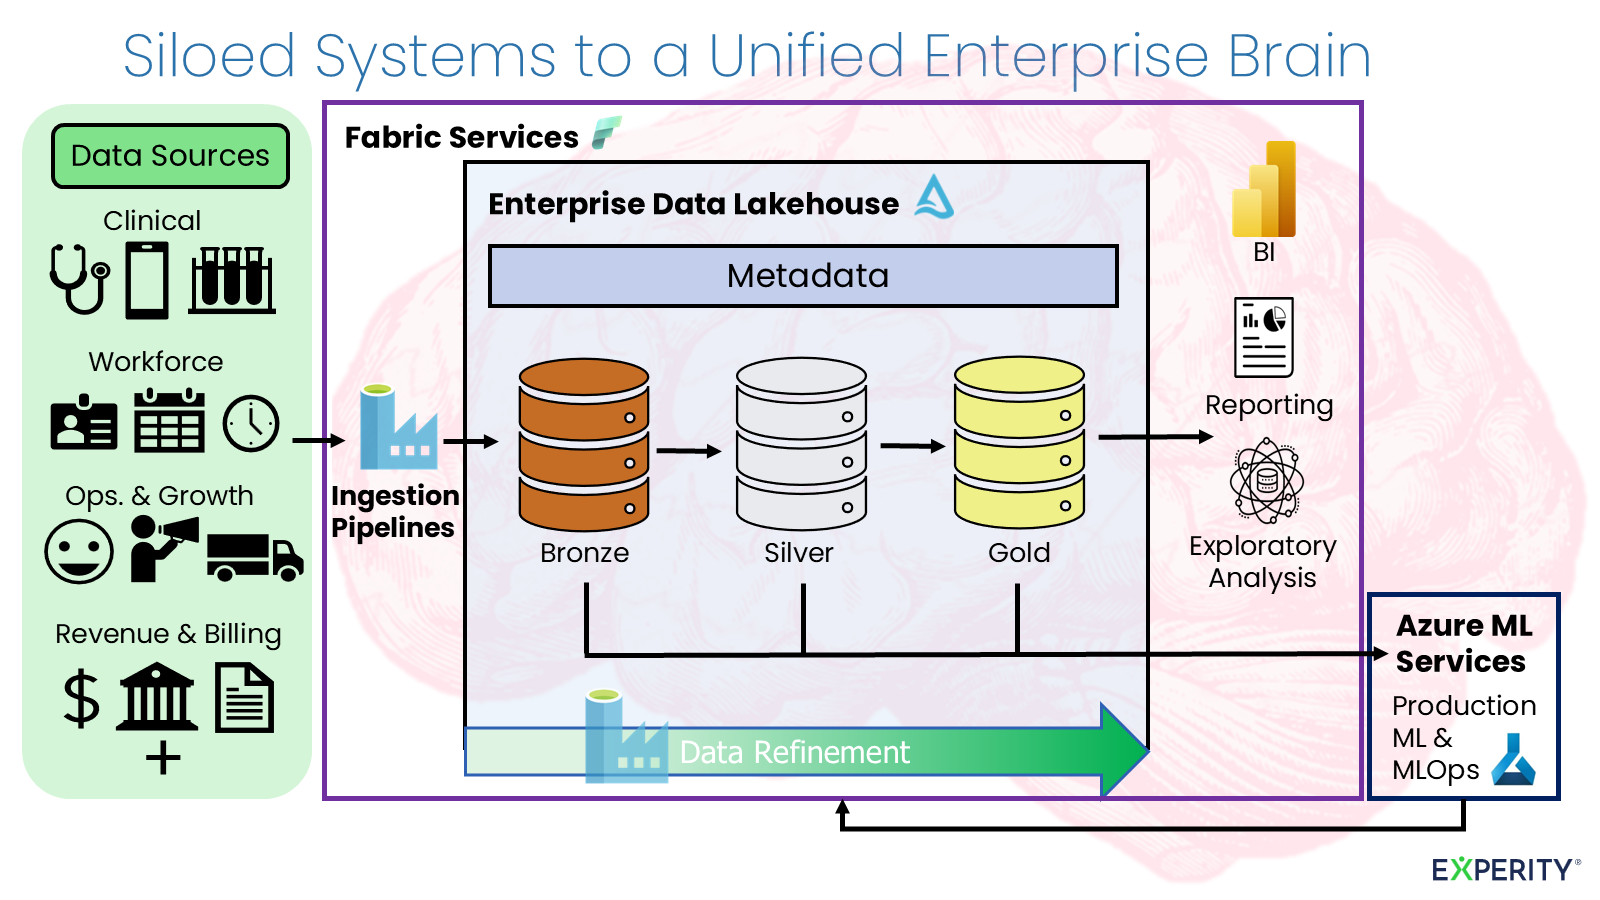
The lakehouse used a bronze, silver, and gold refinement pattern: preserve source data, standardize it once, and publish trusted datasets for reporting and modeling. This made new work faster, but the architecture alone did not create trust.
Finance, operations, and clinical teams sometimes used different definitions for the same metric. Resolving that required governance: agreeing on definitions, documenting lineage, and assigning ownership. The technical platform became useful when people could trace a number back to its source and reach the same answer across departments.
Making prediction operational
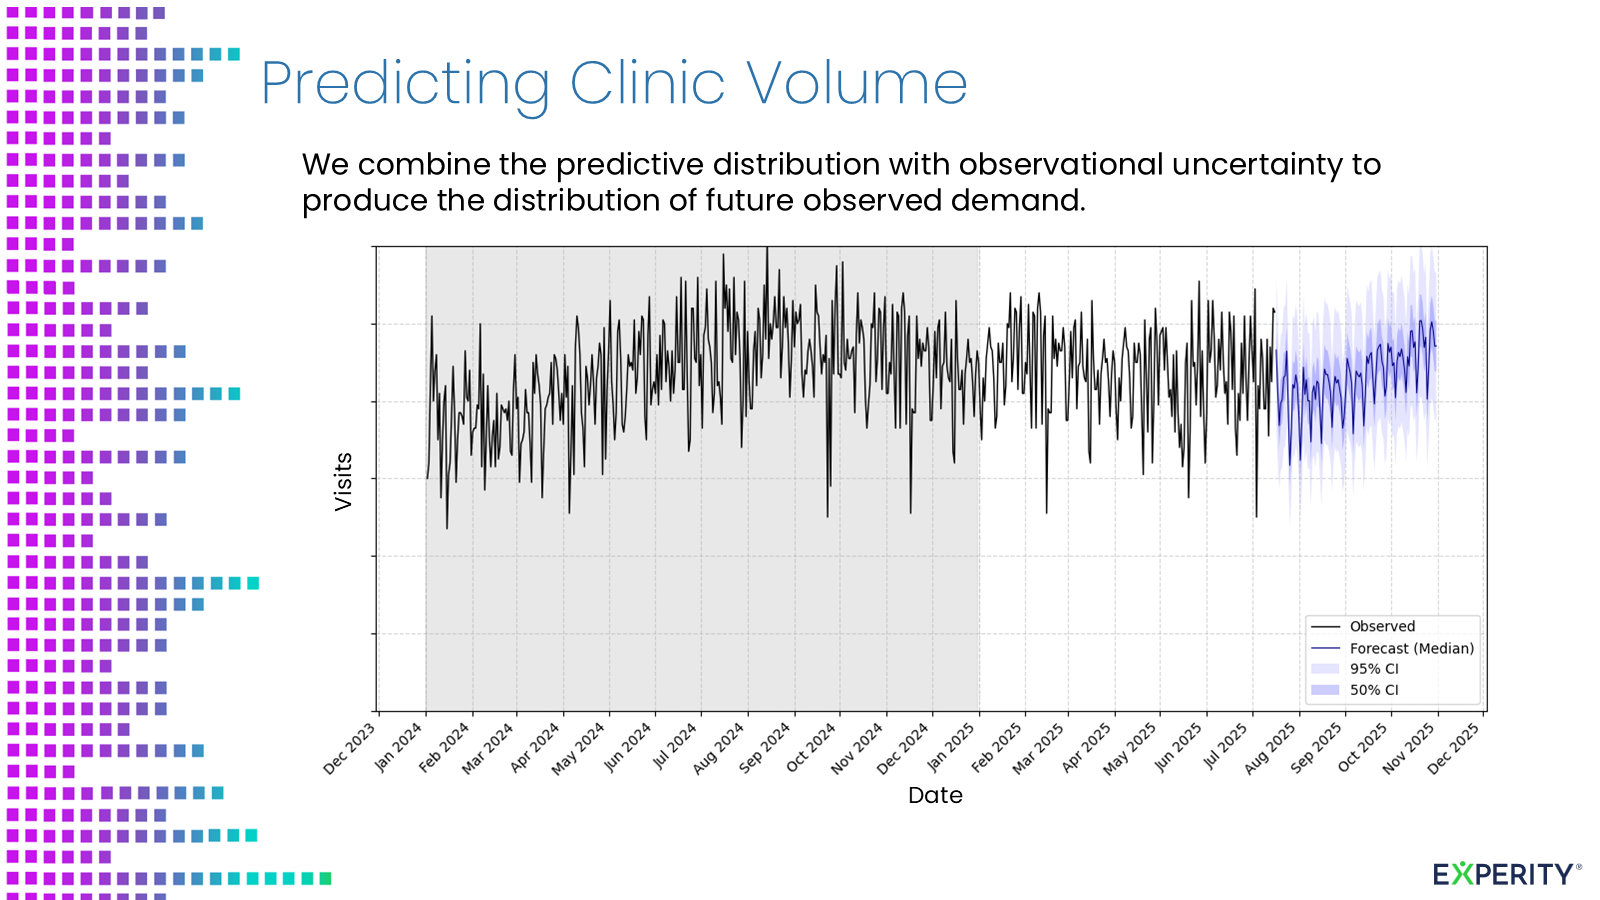
The platform created the conditions for the original goal: forecasting demand by clinic and day across 45 urgent care locations.
The models combined visit history with diagnoses, seasonal disease activity, hospital admissions, local market signals, staffing patterns, and patient-registration data. More inputs did not automatically make the model better; the value came from selecting signals that represented a plausible driver of demand and could be produced reliably in time for a decision.
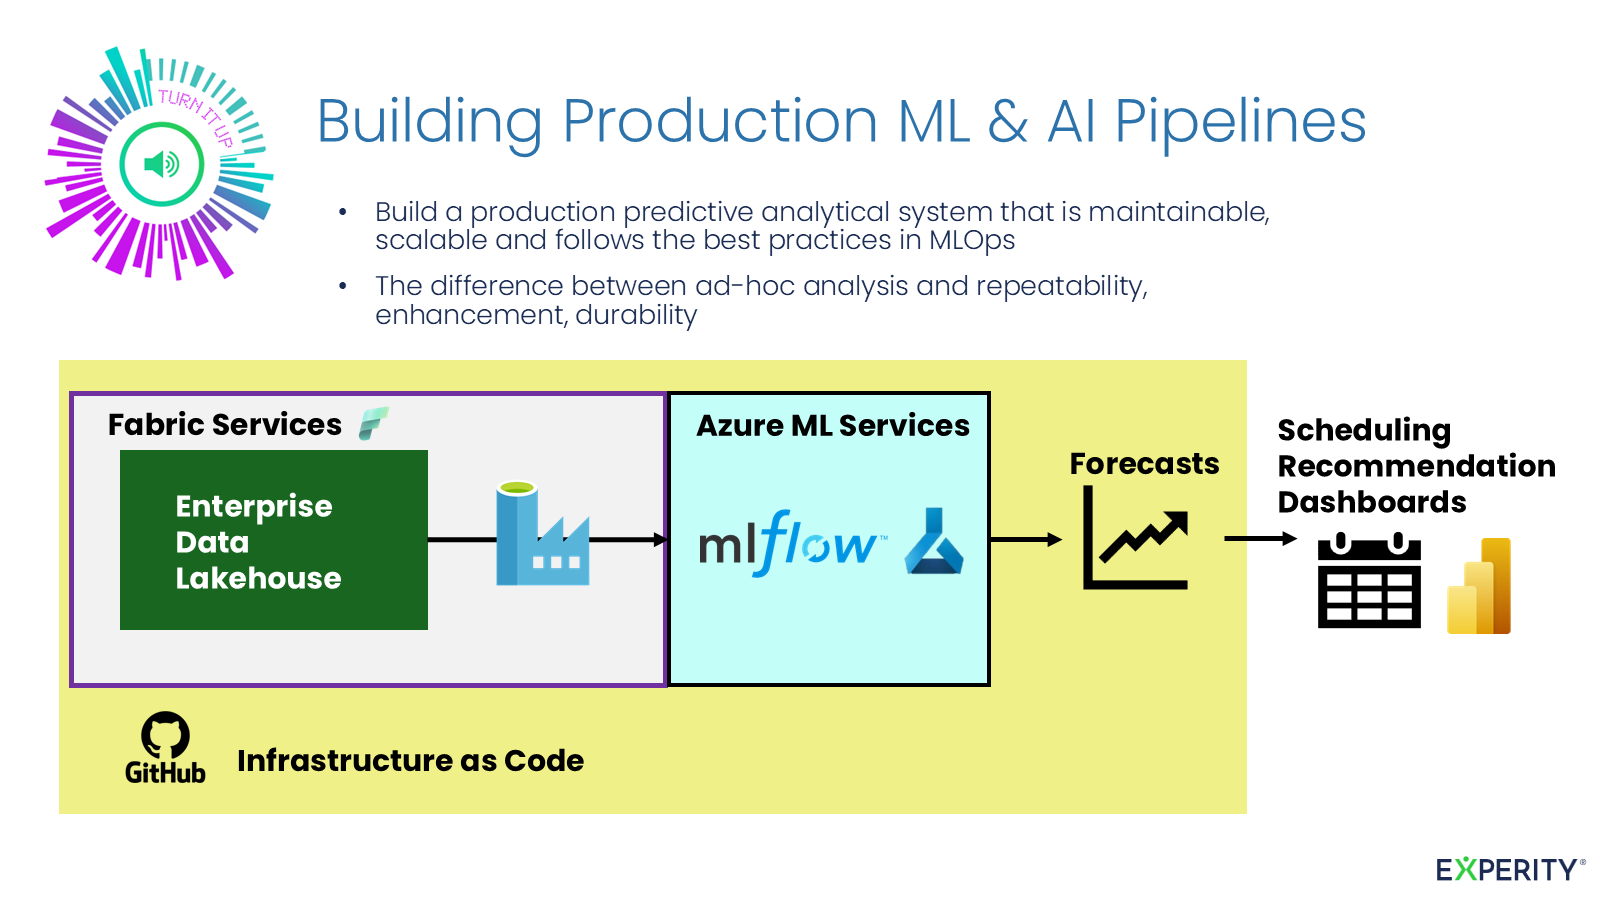
A good forecast in a notebook was not the deliverable. The system needed reproducible environments, tracked experiments, versioned models, scheduled runs, monitored outputs, and a path into the dashboards already used by operations. I used Azure ML and MLflow for the model lifecycle and treated predictions as governed data products written back into the platform.
The model was designed around the staffing decision rather than point accuracy alone. It estimated the probability that demand would exceed operational capacity, allowing practice managers and recruiting teams to consider needs by clinic and day weeks in advance. The important output was not a more sophisticated forecast. It was additional time to act.
The statistical problem—count uncertainty, probabilistic calibration, and translating forecast distributions into staffing thresholds—deserves separate treatment. I cover it in Predicting Urgent Care Demand Under Uncertainty.
Finding demand that visit counts missed
Observed visits were only part of the demand signal. Cancellations and walkouts represented patients the operation could not convert, but the reasons were recorded as inconsistent free text.
I used sentence-transformer embeddings and unsupervised clustering to turn those responses into interpretable groups. The result separated problems with different owners: wait time and walkouts pointed toward throughput and staffing; unavailable services toward clinical scope; insurance issues toward contracting.
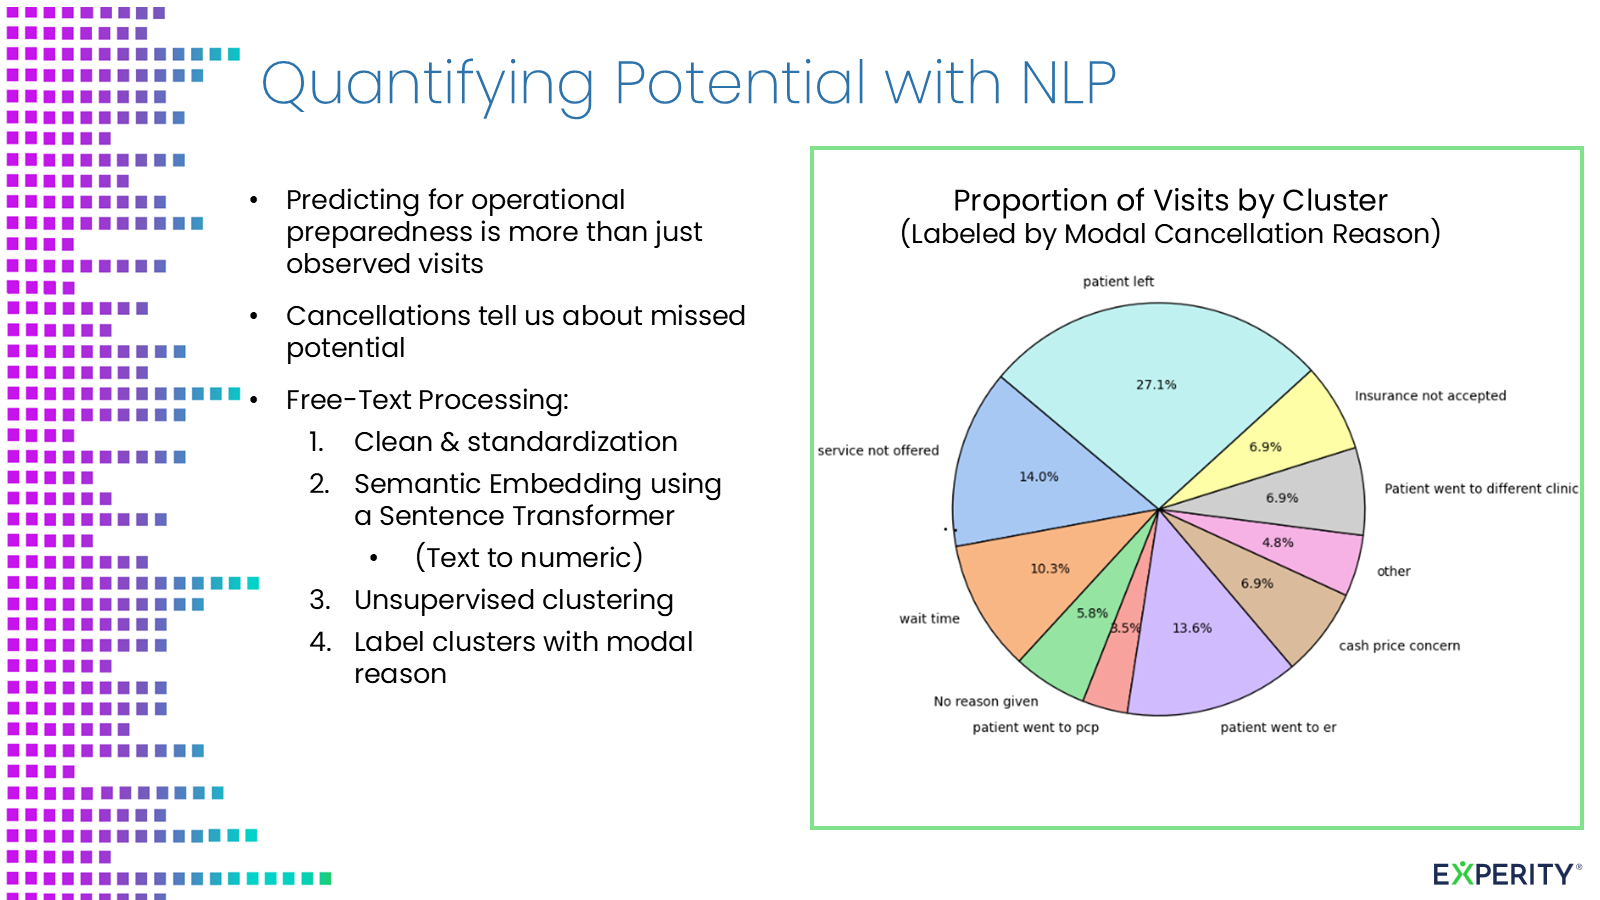
This was a small component compared with the platform itself, but it illustrates the broader strategy: connect data that was previously difficult to use, convert it into a measurable signal, and put that signal in front of the team able to respond.
Outcomes
Within what can be shared publicly: production forecasting and supporting data products across 45 clinics; staffing and recruiting shifted from reactive monitoring toward capacity planning weeks ahead of demand; finance, operations, and clinical teams aligned on shared metric definitions so reporting and ML used one source of truth. Practice managers and recruiting—not analysts alone—became the primary consumers of the capacity-risk forecasts. The platform was funded and staffed for ongoing operation.
Confidential commercial metrics are omitted here; the operational shift is the durable result.
What the work taught me
The project began as a modeling problem and became a lesson in building organizational capability.
- Infrastructure has to follow a decision, not a technology trend.
- Governance is part of engineering when multiple departments depend on the output.
- Models create value only when they fit an existing operational decision.
- Building sponsorship, budgets, and a team can be as important as building pipelines.
- Prediction is not the goal. Better and earlier action is.
The forecasting system was possible because the enterprise platform existed. The platform justified itself because it supported decisions like forecasting, staffing, reporting, and planning. Each made the other more valuable.
Presentation
Session B08 — From Insight to Action
Urgent Care Connect 2026 · February 23–24, 2026 · Grand Hyatt Nashville