
Nonporportional hazards models for patient outcomes
During the COVID-19 pandemic, I had the privelage to work on the Northeast Big Data Innovation Hub project CritCOVIDView: A Critical Care Visualization Tool for COVID-19. Led with the clinical and research expertise of Todd Brothers PhD, PharmD and Mohammad Al-Mamun PhD, as part of the team, I created data processing pipelines, conducted statistical analysis for insight and trained statistical models for predicting patient outcome and the clinical influences on these outcomes. The core goal of this project was to develop predictive models and statistical insights to help clinicians make data driven medical decisions during the COVID crisis with the insights and analysis from high dimensional patient data. Recently, some of the survival (aka time to event) modeling work was published in the medical journal SAGE open Medicine. In this post, I will summarize the modeling components of this paper that I worked on as part of the team.
This project targets analysis of the interaction between the prevalent and dangerous condition of Acute Kidney Injury (AKI), and the interaction with medications, patient demographics, and COVID infection.
Because of the sensitivity of the data I can neither share the data nor analysis code, but I can and will provide a description of the analysis process, results, and implications.
Objective:
Acute Kidney Injury (AKI) is a dangerous condition and unfortunately common condition in the ICU, impacting millions of patients every year and associated with a wide range in adverse patient outcomes including death. The goal of this analysis is to model the outcomes of these patients (both mortality and recovery) as well as to identify the treatment and patient conditions that may impact the patient outcome.
Data:
This study recieved all proper ethical approval (see publication details), and used deidentified, retrospective data.
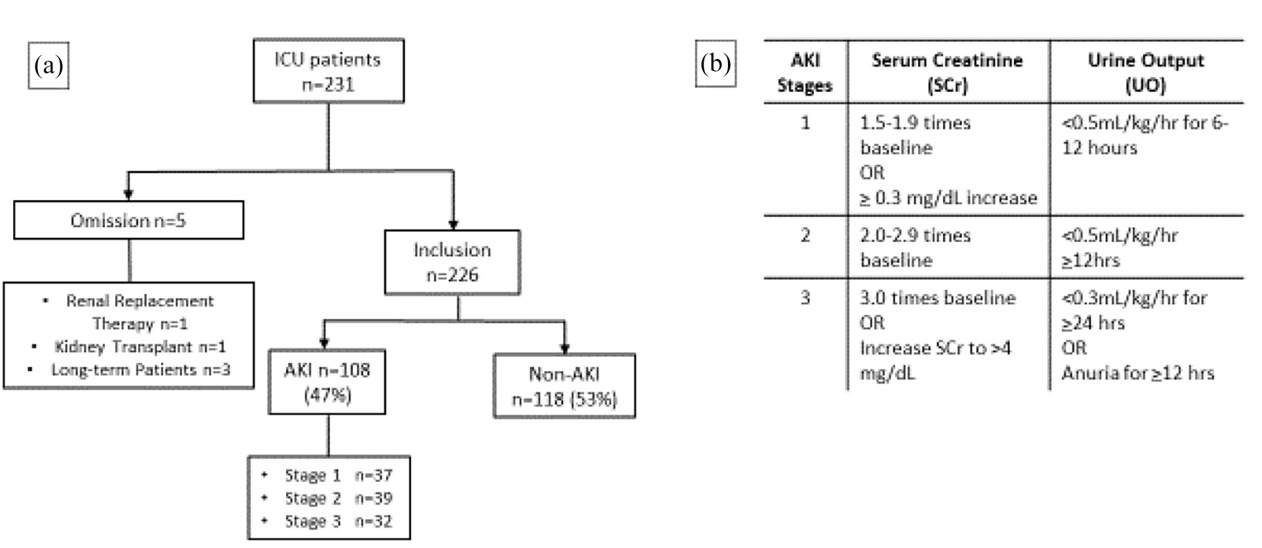
226 ICU patients were included in this study. Data included all available records of vitals, demographics, medications recieved, laboratory readings (from blood-work), and oxygenation. All patient data were available in completion during the entirety of the patient stay.
Data Processing:
AKI as a condition can be classified into 3 stages (stage 3 being the most severe), and was calculated via the criteria of the Kidney Disease Improving Global Outcomes standard. To accomplish this, I created a data pipeline which used rolling windows, applied over the temporally structured data, to detect the AKI criteria during the patient staty. By applying the AKI criteria in rolling windows of the patient data, important temporal traits were retained such as the time to onset of AKI, worsening/improving of condition over time, and time between diagnose and outcome (recovery/mortality).
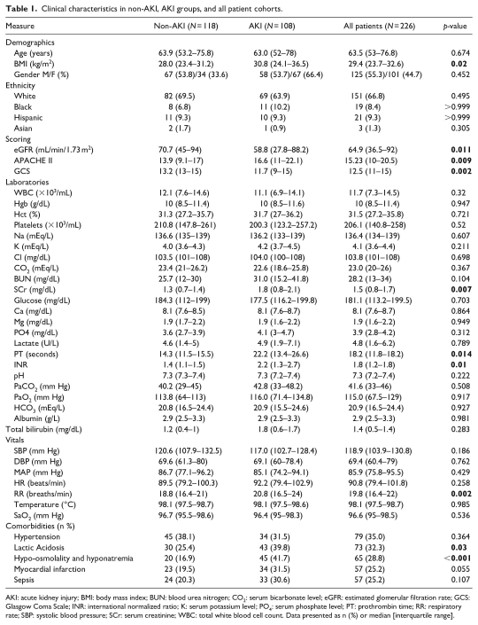
First, the descriptive statistics were calculated for each study group. The mean and interquantile range were calculated for each continuous variable, and for categorical variables, the count and percentage of patients meeting the conditon were calculated. To statistically test differences between the study groups, pair-wise t-tests were used for continous varaibles, and a chi-square test was used for categorical features. Fisher’s exact test was used to statistically test differences in count data for medications classes received due to the small sample sizes for patients recieiving certain medication categories.
To prepare the data for survival modeling, the data had to be processed into a time-to-event format. In this format, each row was occupied by the data for a given patient and condition status. In example, it may designate the AKI stage 1 status of patient X. If patient X was also non-AKI, a seperate row would designate their data for the non-AKI period of their stay. Each row contained an event (recovery, worsening AKI condition, mortality), the time from diagnosis or ICU entry to the event, the patient demographics, and average laboratory, oxygen, and vitals data. In addition, a dummy encoding was used for the medication classes received during their stay. Altogether, the transformed data gave information on the time to event, the event, and the patient conditions leading up to the event.
Analysis & Results:
The first basic question is how our AKI vs non-AKI patients compare. A descriptive table and pairwise comparisons (chi-square and t-test for categorical and continous variables respectively) were used to describe the differences between the cohort of AKI and non-AKI patients.
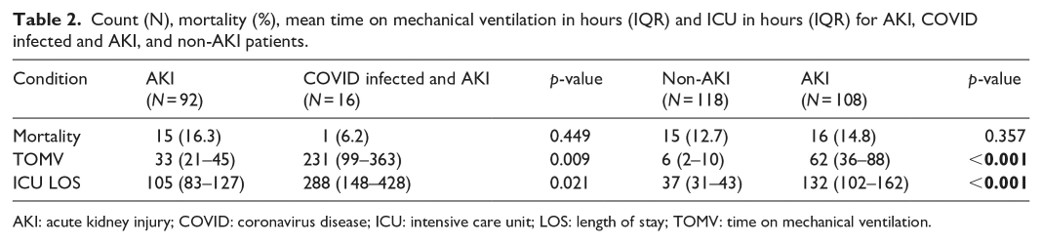
Outcomes included the time in ICU, time on mechanical ventilation, and mortality rates were also compared for each cohort
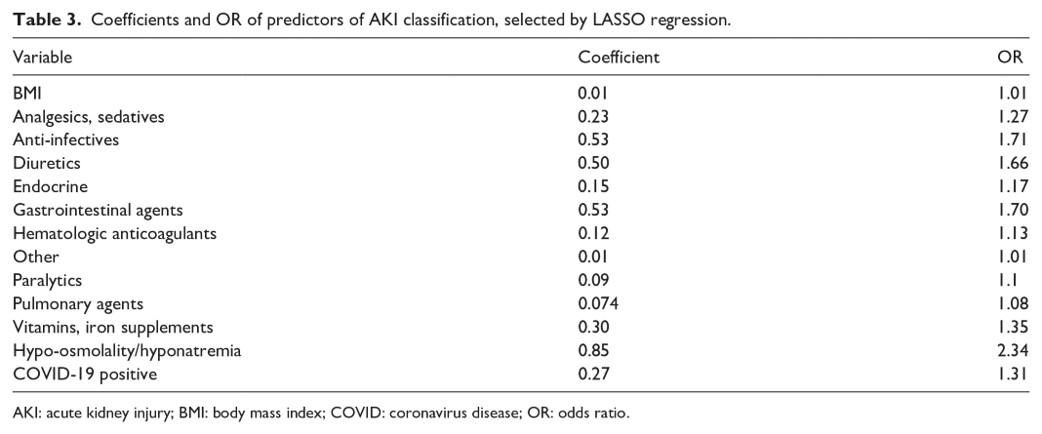
After establishing medical differences between our AKI and non-AKI patients, we then ask what might predict a patient becoming an AKI patient. AKI classification (binary reponse variable) was predicted in a LASSO logistic model, a model which penalizes parameters, such that the model can serve for feature selection. The features selected by the model provide information on what predicts AKI classification and comparison of the odds ratio between the AKI and non-AKI group inform us to the effect size.
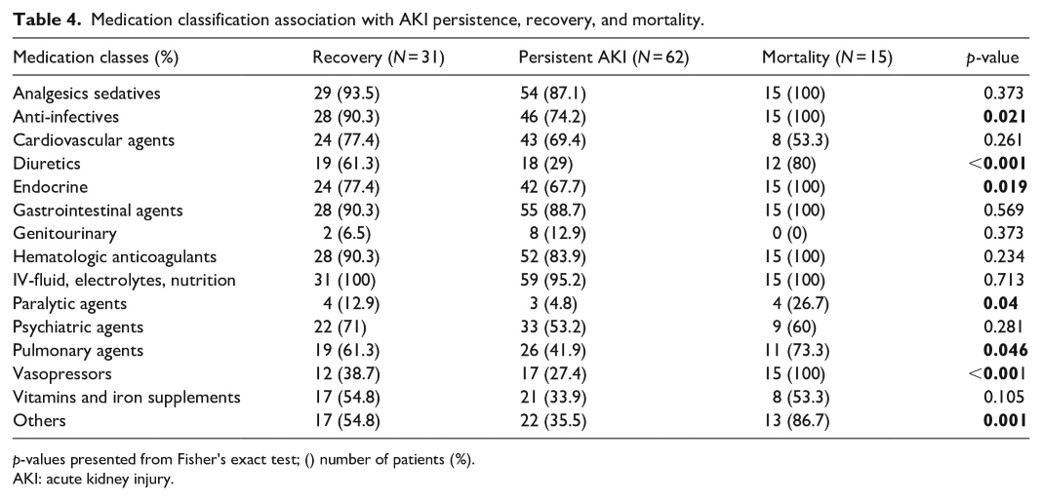
We also asked which medication classes might influence the AKI outcome (recovery, persistence of AKI, or mortality). Because the sample size limited statistical power in survival models, I employed a fisher’s-exact test to compare the number of patients receiving a given medication class, with the patient outcome as a dependent variable. That is the test compared whether more patients with a certain outcome received a given medication category. The Fisher’s exact test was used because of the ability to statistically test small sample sizes.
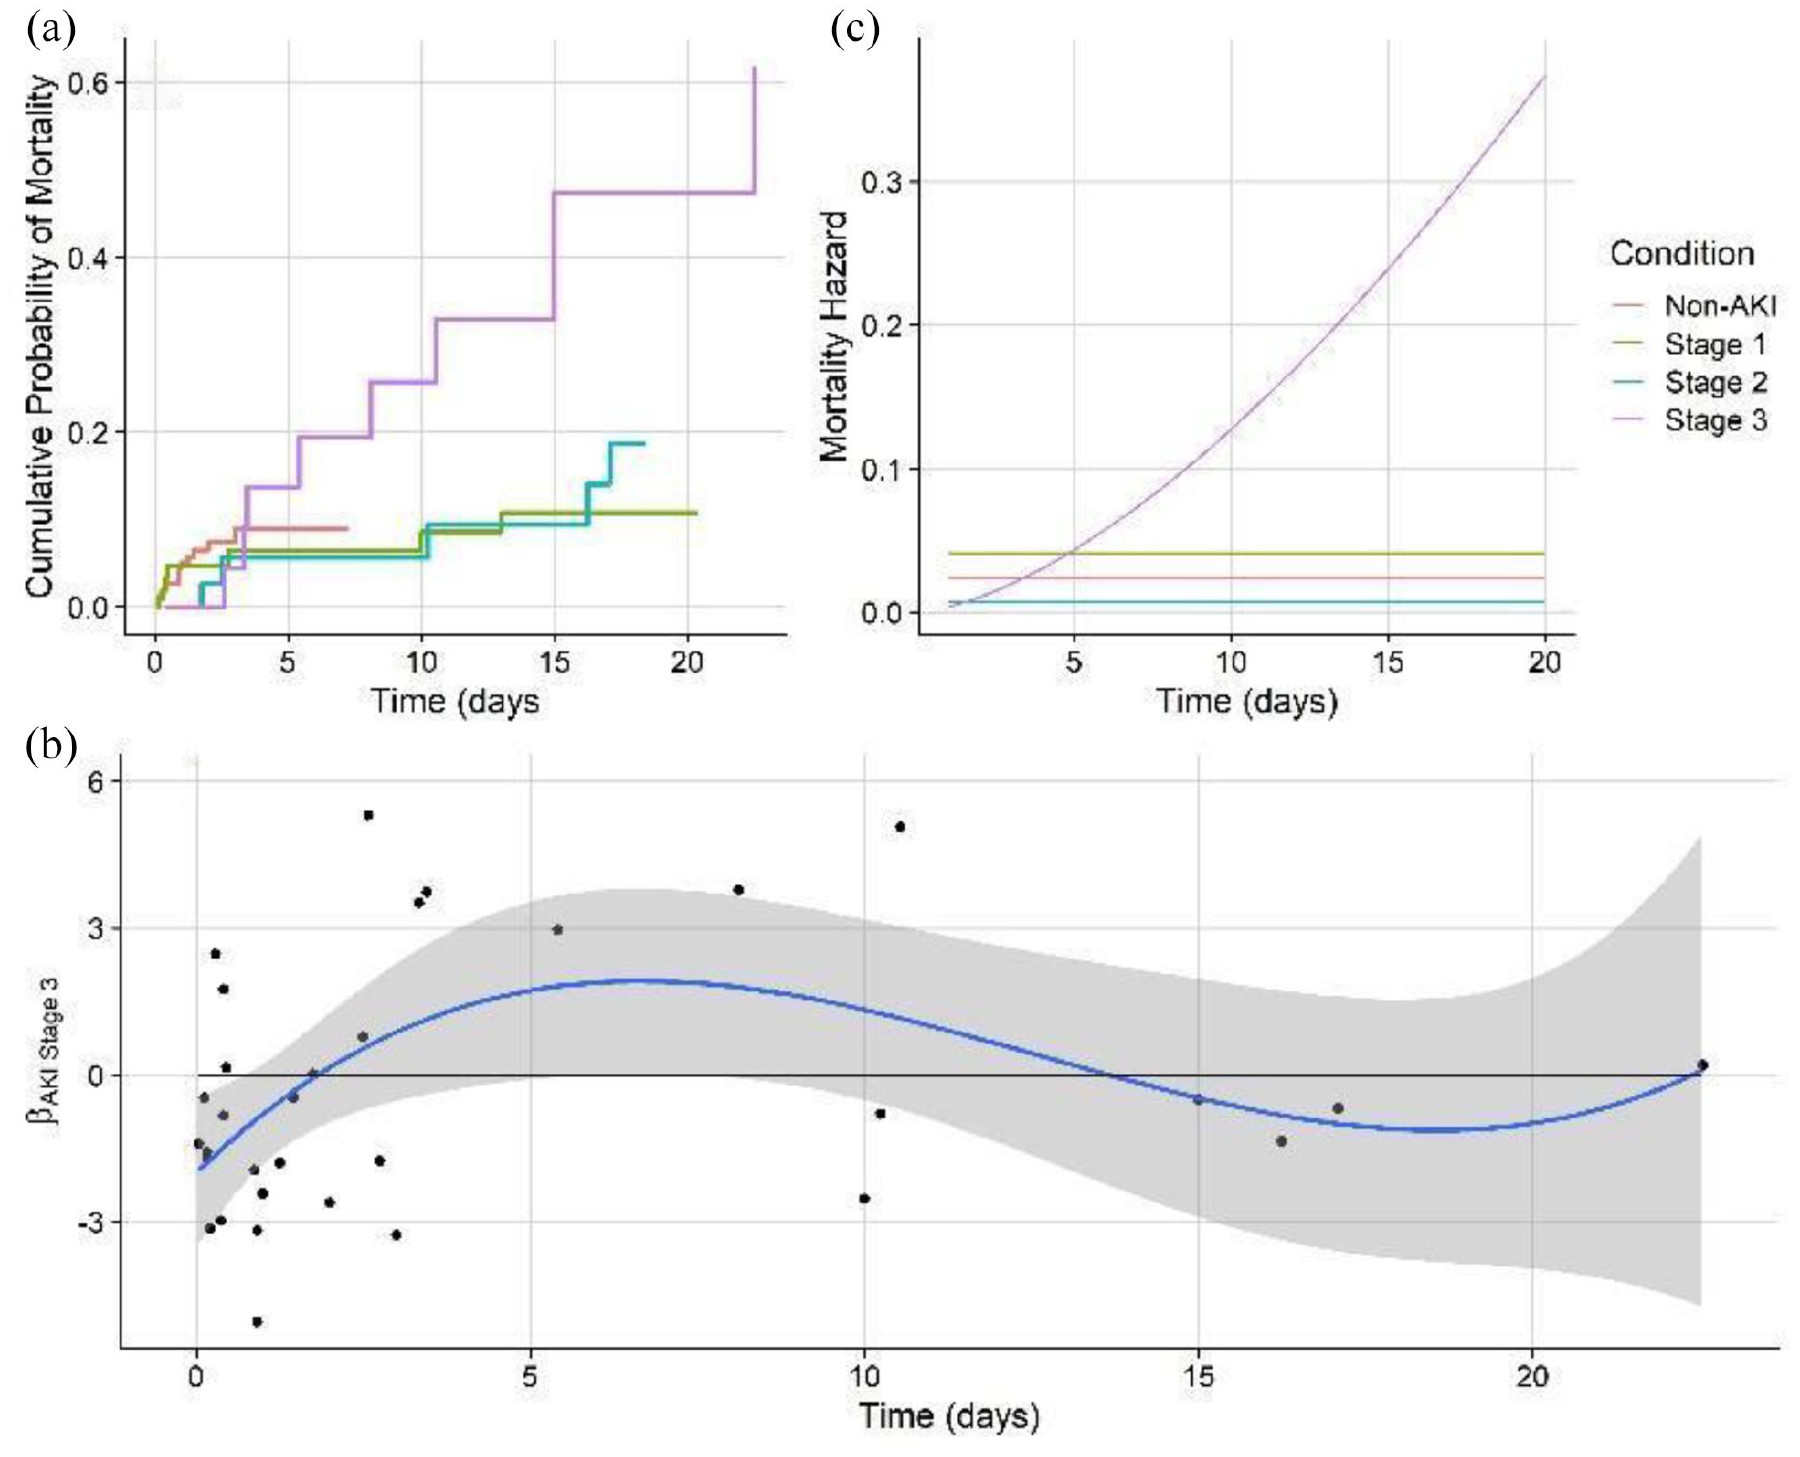
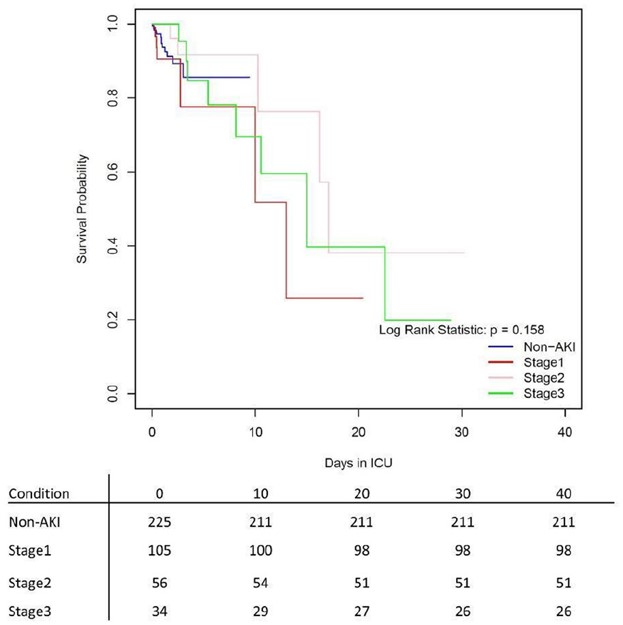
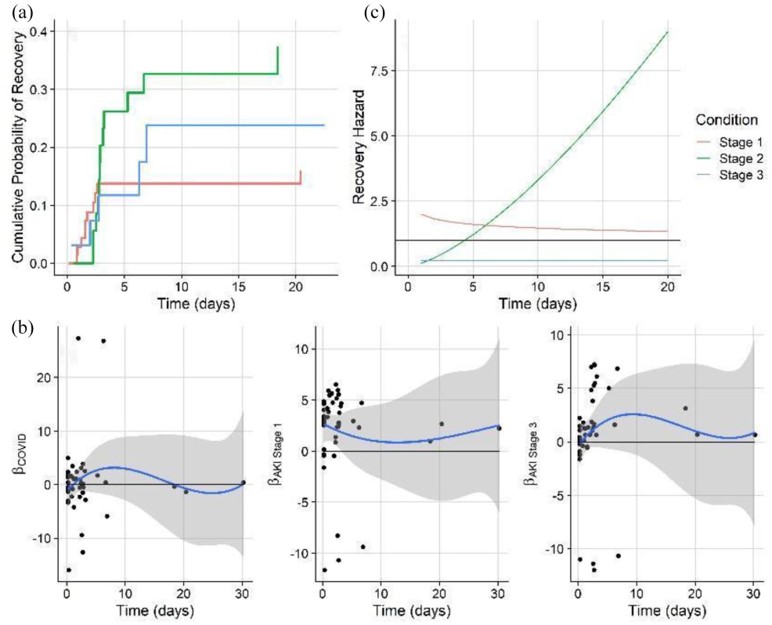
I calculated the Kaplan-Meier curve, which shows survival probability by each AKI class. It is a standard in survival modeling and we chose to show it as a reference. However, usage of this curve often violates statistical assumptions, and the same is true here (Later we will go on to show with non-proportional hazard modeling how survival differences become apparent with the correct model structure). While Kaplan-Meier estimates of emperical surival probabiltiy show little difference in the survival probablity in any of the AKI groups, it does not account for competing outcomes which means, that multiple events can happen which prevent a patient from experiencing a single target event. For example, in our data, a patient may be diagnosed with AKI stage 1. The event we are monitoring may be recovery, but they may also become censored from the study because they became a more severe AKI stage, or died. Further, the often cited log-rank statistic which test for differences in survival curves by group cannot handle time-varying differences in survival probablity. Clearly, these are major assumptions that must be addressed.
As a consequence of the nature of competing hazards in our data, a cox regression was used to test the difference in the proportional hazards for recovery and mortality in each of the AKI classified patient groups and control group. The target variables in independent models were recovery and mortality. The included predictors were AKI status, demographic traits, and medication class received.
The Cox proportional hazards model, is a model for the hazard rate, or the instantaneous probability of an event occuring. Obviously, in the real world, instantaneous rates are difficult to interpret, but if this rate is integrated over time, it gives the probability of an event occuring up to that point in time. Further, the parameterization of the Cox model for the instantaneous hazard will give us valuable information about what influences the probability of an event (like recovery or mortality) occuring. The Cox proportional hazards model is configured as such:
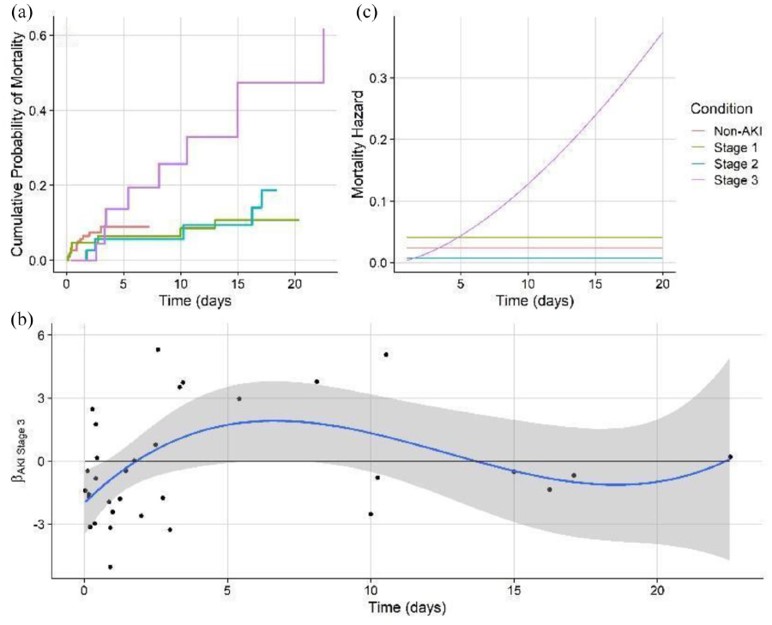
\[\lambda(t \vert X_i) = \lambda_0(t)exp(\beta_1 X_{i1}, + ... + \beta_p X_{i,p})\]However, analysis of the Schoenfield residuals showed significant time-variation in the covariate effects. Therefore, a non-proportional hazards model was run whereby features that signficantly time varied as indicated by Schoenfeld residuals, were given temporal flexibility.
Conclusions:
-
The pairwise analysis of AKI and non-AKI patients showed that AKI patients varied significantly in many traits including vitals, laboratory results, and commorbidities
-
Pairwise comparisons of outcomes showed significantly higher time in the ICU and time on mechanical ventilation for patients who were AKI classified.
-
LASSO logistic regression identified the increased risk of developing AKI for patients with higher BMI, with hypo-osmolality/hypo-natremia, and on certain classes of medications, especially diuretics, anti-infectives, and gastrointestinal agents.
-
The non-proportional hazards model predicting mortality showed that severe AKI patients have a mortality risk that dramatically rises over time, as compared to stage 1 and stage 2 patients who have static mortality risk. This highlights the severe danger of entering stage 3 AKI without recovering.
-
The non-proportional hazards model predicting recovery showed that stage 1 AKI patients have a recovery risk that dramatically rises over time, as compared to more severe stages. This suggests that patients who develop AKI and can be kept to a low stage are likely to recover quickly. This emphasizes the importance of mitigation and reducing the potential for further kidney damage (such as by stressful medication regimes) that could worsen AKI condition and thus the potential for adverse outcomes.